1. Overview
A Genba walk is a visit to the production floor to spot problems where they happen. Each problem, called a finding, needs an owner, a fix and someone to check the fix. On paper, findings got lost between the walk and the fix.
The Genba system puts every finding in one place, from the moment it is photographed to the moment it is closed. People on the floor do not need to learn a new system. The follow-up happens in WhatsApp, which they already use.
2. Mobile App
Staff report findings from their phones or tablets: a photo, a location, a category and how much it matters. They then follow each one through to its fix (corrective and preventive action, or CAPA).
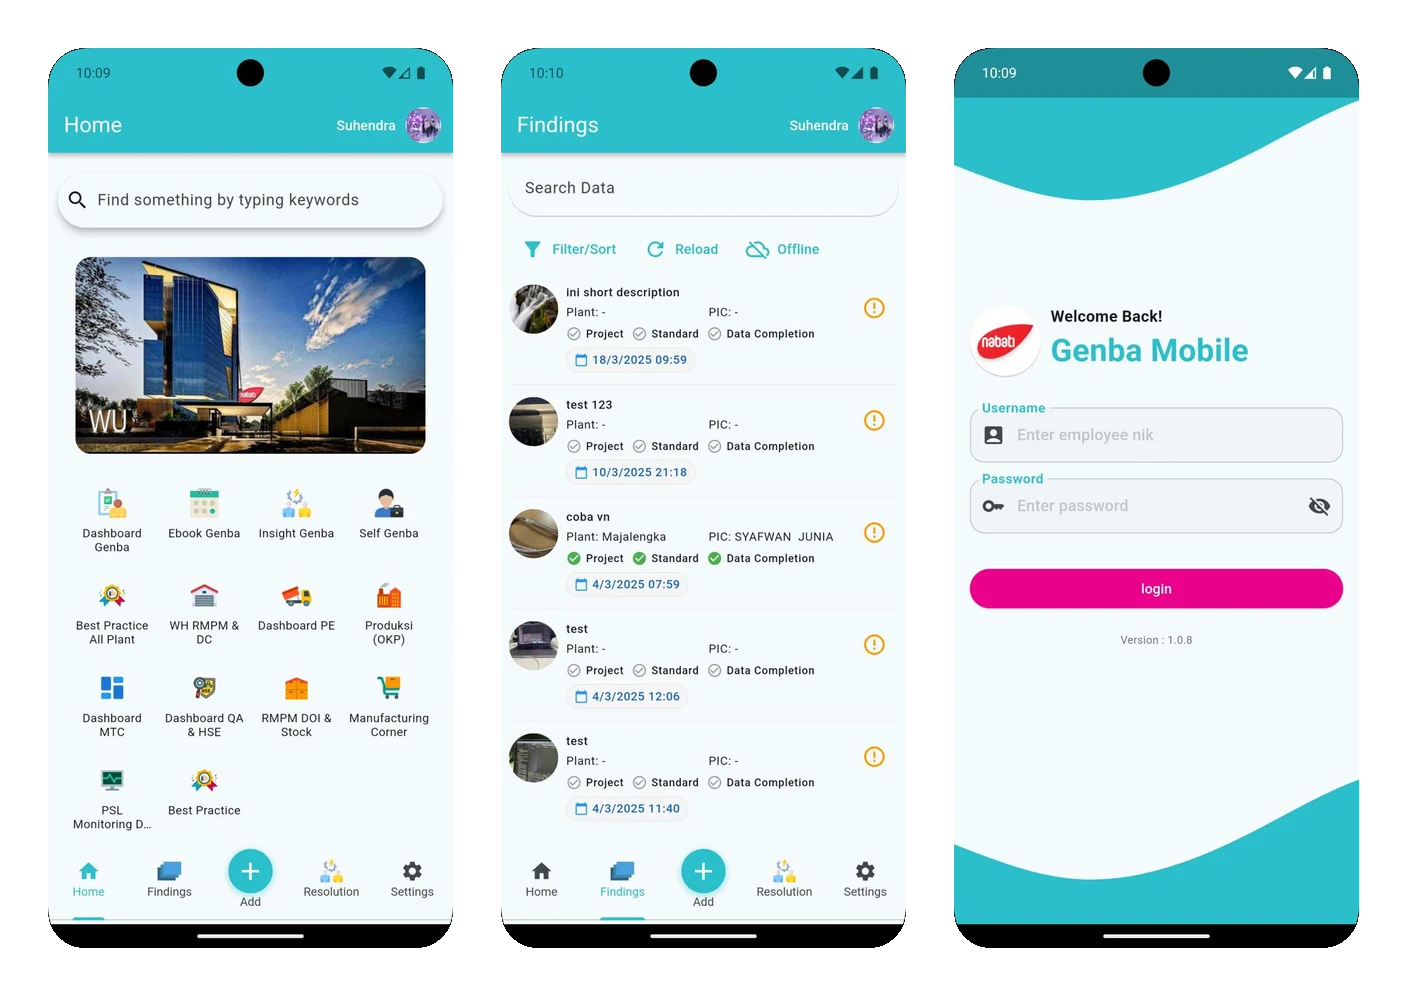
Figure 1: Genba Mobile, showing the home screen, the findings list and the login screen. Images from the Play Store listing.
3. WhatsApp Follow-up
Every Self Genba finding is posted automatically to the right WhatsApp group. The post includes:
- the photos, location (building, sector and line), date and how serious the finding is;
- the Parameter Genba standard that should hold, with a link to it (see Section 4);
- the people in charge (PICs), tagged by name.
PICs answer by replying to the message with #CA (corrective action), #PA (preventive action) and #STATUS (open, on progress or closed). The replies are read back into Self Genba and show up on the dashboards in real time. Nobody has to open another app or fill in a recap.
Behind this runs a 24/7 AI agent on AWS Bedrock and a self-hosted WhatsApp gateway. The agent reads the WhatsApp replies, along with the Production Plant Data Support (PPDS) email reports, and feeds them into one operations dashboard. Recaps used to be compiled by hand and took days. The time to resolve a finding went from days to minutes.
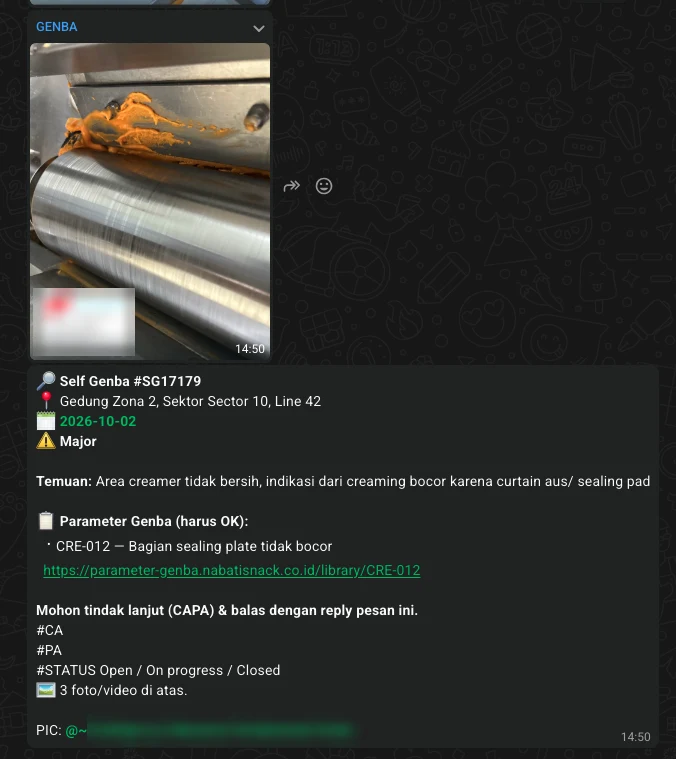
Figure 2: A Self Genba finding posted automatically to WhatsApp, with its Parameter Genba standard, the reply format for CAPA and the PICs tagged. Names are blurred.
4. Parameter Genba
Parameter Genba is the library of standards (GMP and 5R) that a line SHOULD meet, grouped by process: mixing, baking, creaming, cooling, cutting, packaging and more. Each standard has a code, an “OK” condition, and reference photos of what OK and not OK (NOK) look like. For example, CRE-012 means the sealing plate does not leak. Every finding is tied to the parameter it breaks. This is how the dashboards can show which parameters are broken most often.
Parameter Genba is linked with ai-ebook. Each standard lists the real ebook cases it is meant to prevent, and the library can be filtered to standards that have such a case.
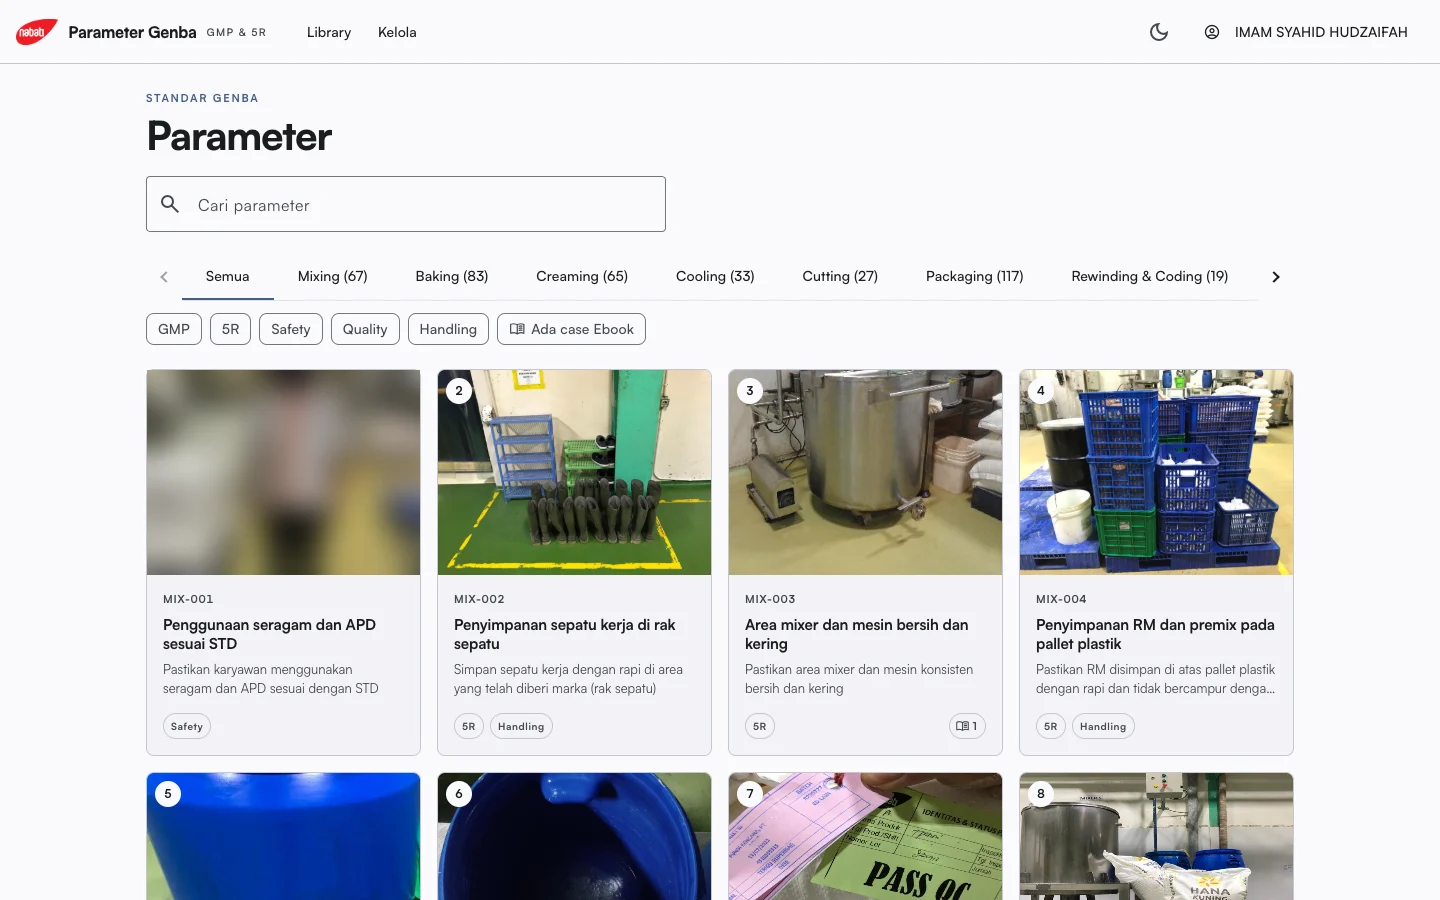
Figure 3: The Parameter Genba library, with standards grouped by process and tagged GMP, 5R, Safety, Quality or Handling. The worker photo is blurred.
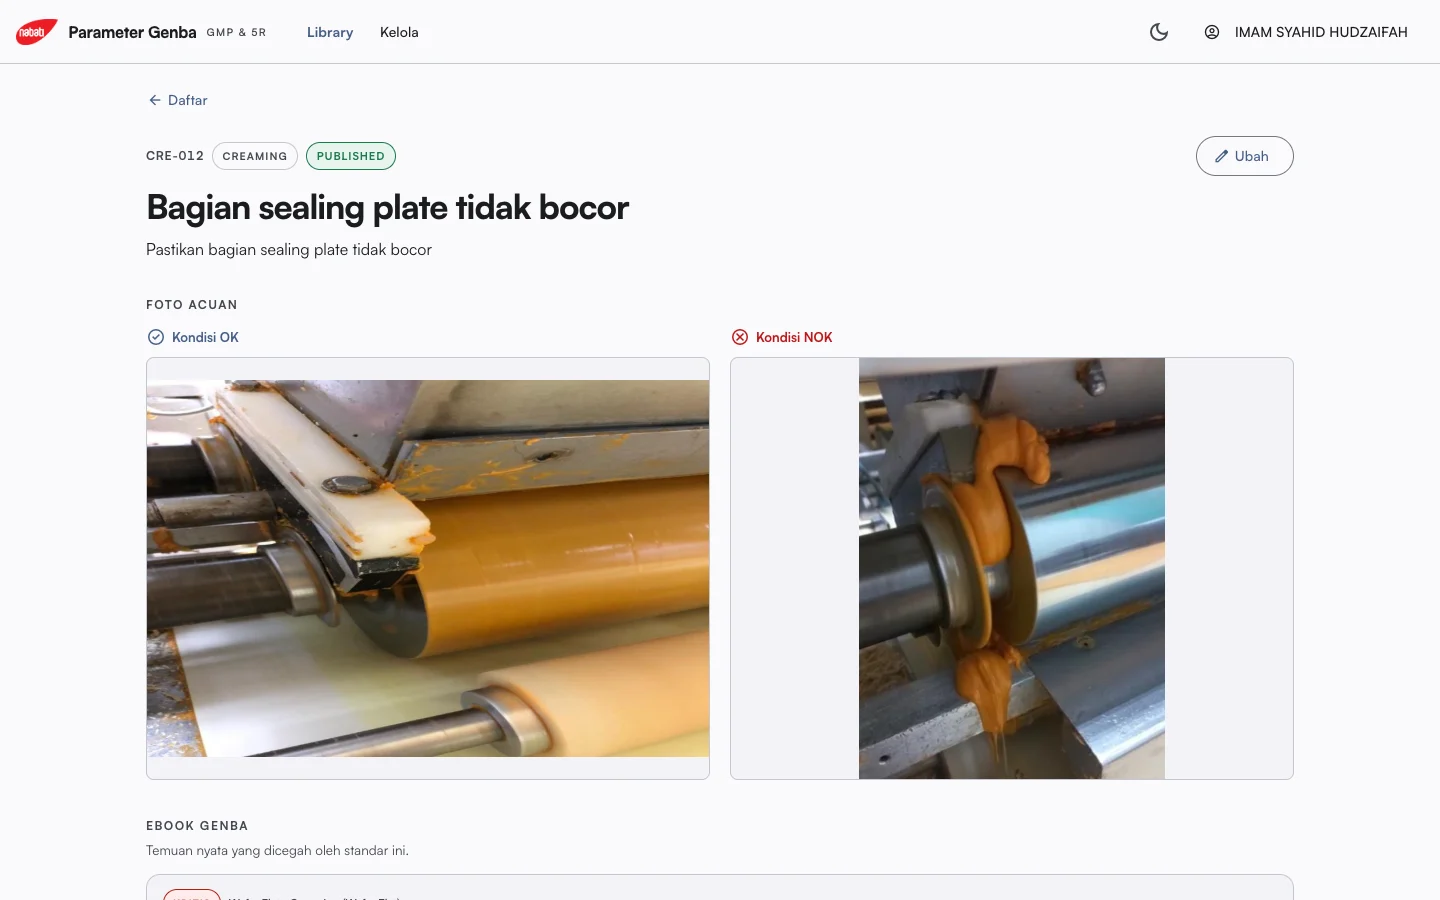
Figure 4: Standard CRE-012, with reference photos of OK and NOK and, below, the ebook cases it prevents.
5. Paperless Checklists
Shop-floor checklists and work instructions used to be filled in on paper, then filed and mostly forgotten. They are now scanned and run through OCR, and an AI step turns the raw text into fields. The original images go to MinIO, and the structured data goes to a database.
The same checklist rarely looks the same twice, so the schema is designed for multiple layouts, shifts and business units. A new form does not need a new table. This replaced ~80% of paper records on 3 production lines.
6. Dashboards
- Dashboard Genba: all findings across plants, sectors and business units, by status, category and impact, with an estimated cost saving.
- Self Genba: each plant’s own view of its findings, showing how many have a CAPA, how many have not been answered yet, which person in charge (PIC) is ahead or behind, and which parameters are broken most often.
- TV board: a per-sector board for screens on the shop floor.
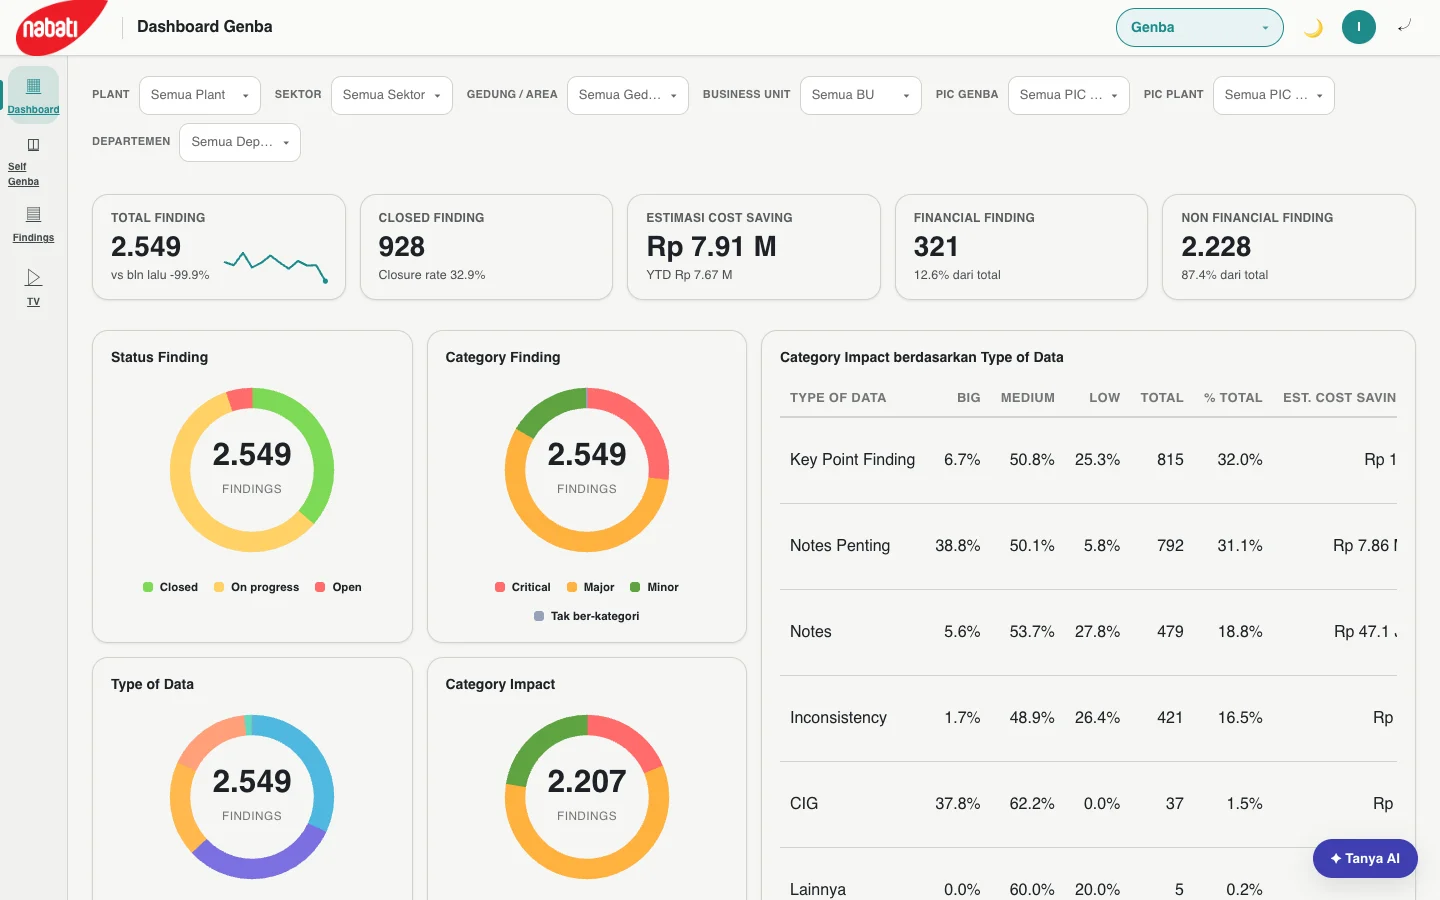
Figure 5: Dashboard Genba, with 2,549 findings across plants by status, category and impact, plus the estimated cost saving.
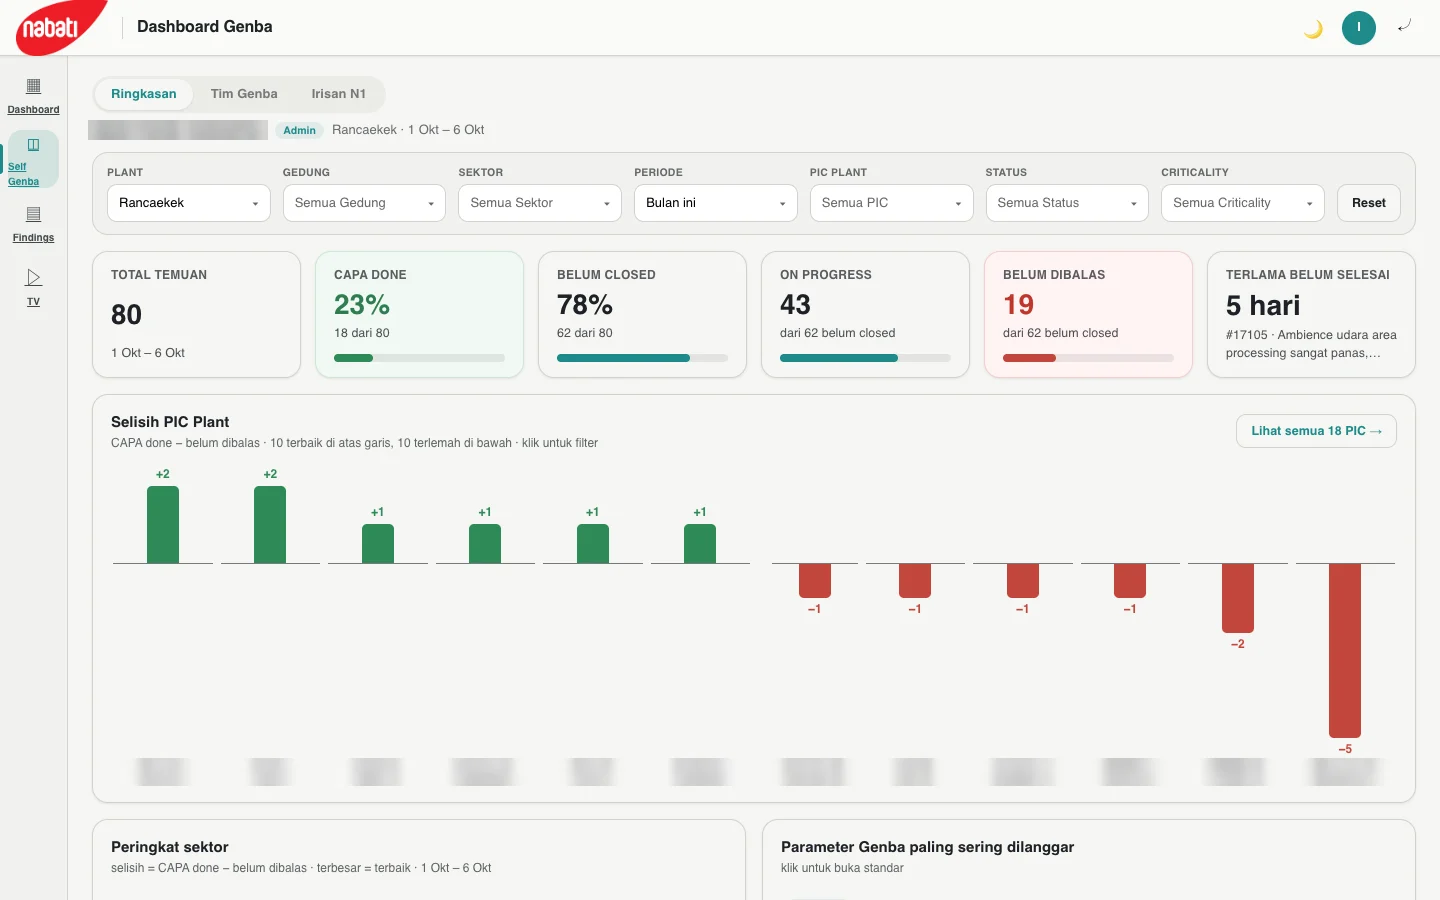
Figure 6: Self Genba for one plant, showing CAPA progress and which person in charge (PIC) is ahead or behind. Names are blurred.
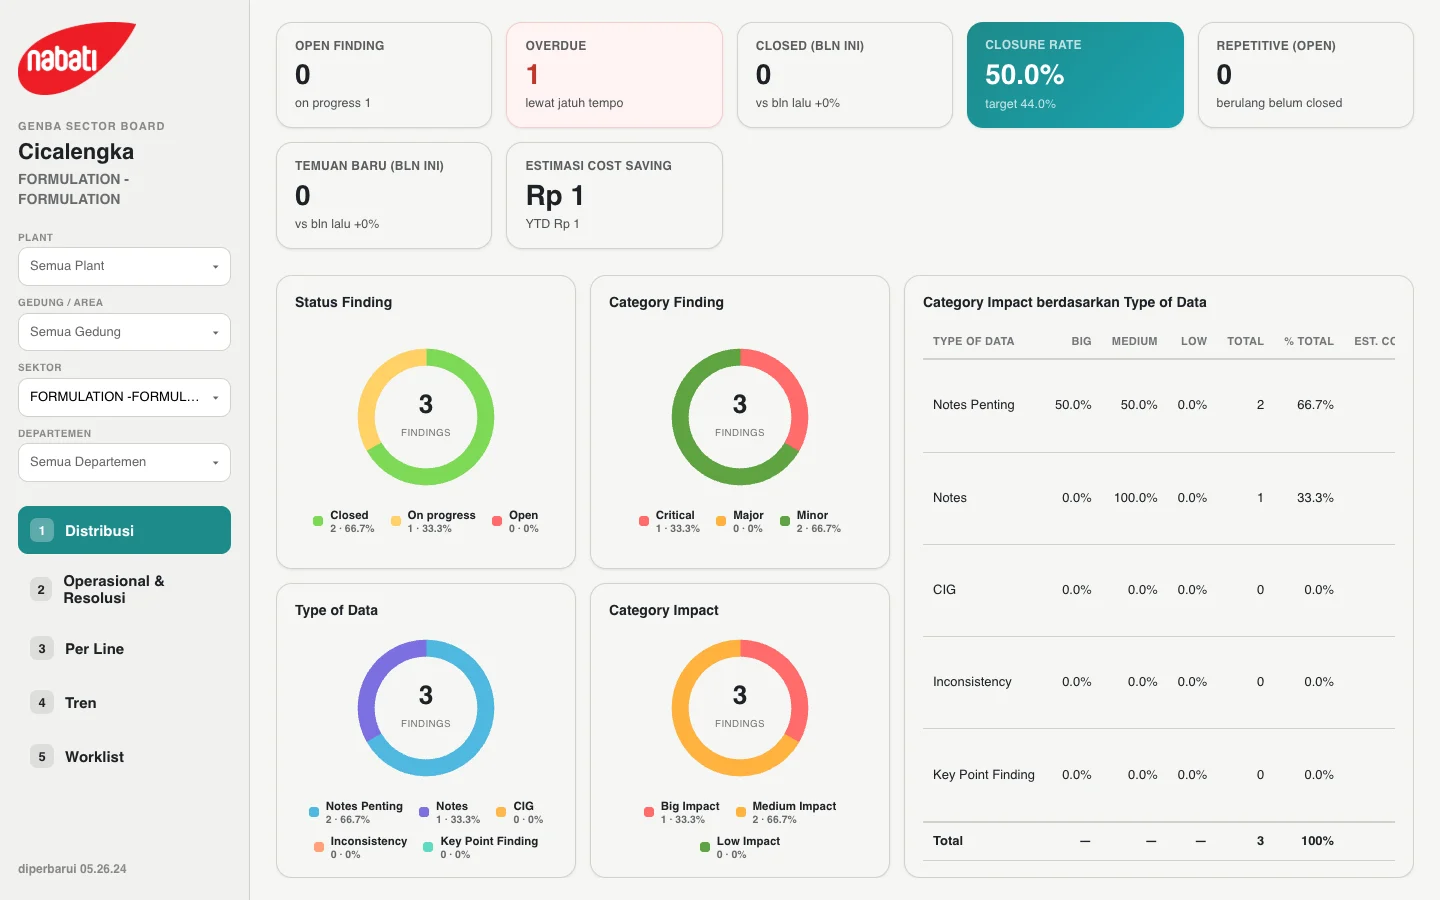
Figure 7: The TV board for one sector, made for screens on the shop floor.
7. Related
Answers to recurring problems live in ai-ebook. Genba improvement projects are planned and tracked in pms.