1. Overview
Behind the products sits the platform they run on: where logs and events go, how services talk to each other, who can log in where, and how code gets from a laptop to production. None of it is visible to users, which is how it SHOULD be.
2. Observability
With 15+ services, finding out why something was slow meant reading logs on several servers. Logs, traces and usage events now flow through one event-driven pipeline: OpenTelemetry → Kafka → ClickHouse and Elasticsearch, with HyperDX dashboards on top. Kafka sits in the middle so a slow store never blocks the services that send data.
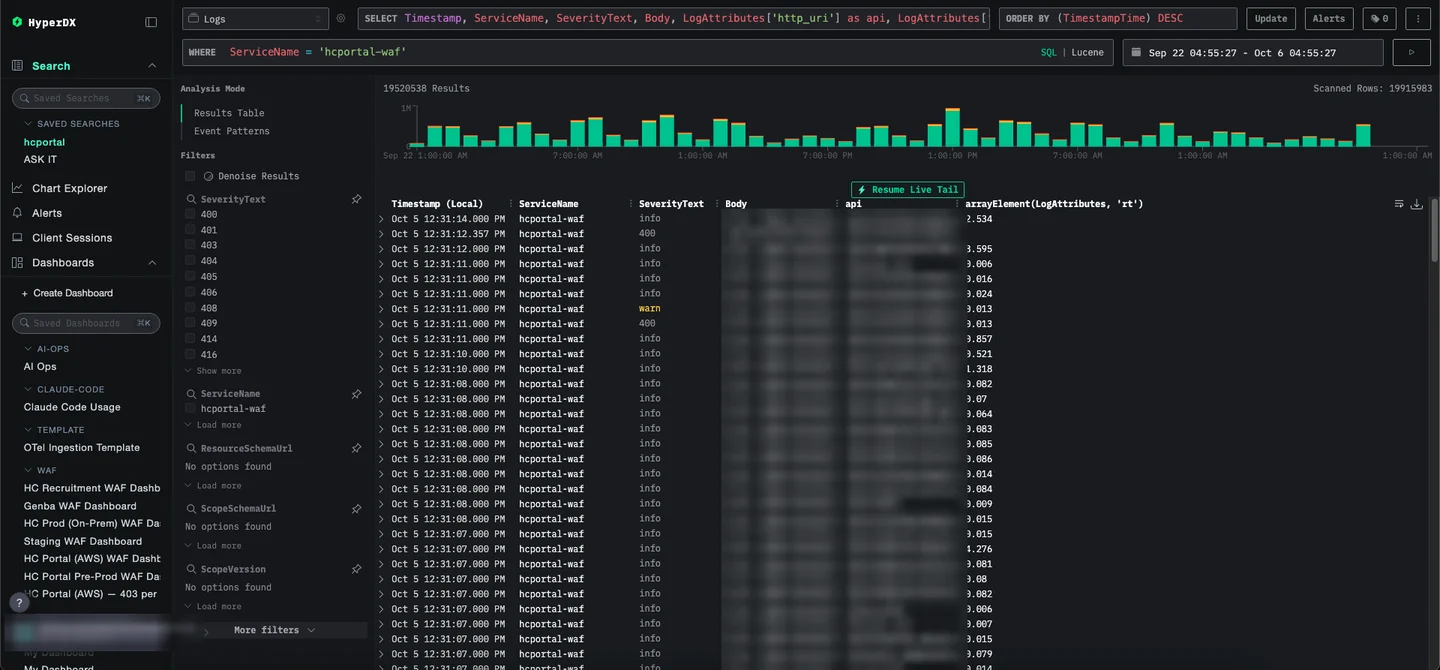
Figure 1: HyperDX searching two weeks of WAF logs for one service, about 19.5 million rows. Request paths are blurred.
The same dashboards show slow endpoints, what the web application firewall blocked, and how teams use the internal tools. They later tracked Claude Code adoption after the author trained 20+ engineers.
3. Event Streaming
Kafka also connects the business systems. Recruitment logins, Genba finding reminders, project updates and telemetry all travel as events, so one slow system does not hold up the others. Schemas are registered in a schema registry, so a producer cannot quietly break its consumers.
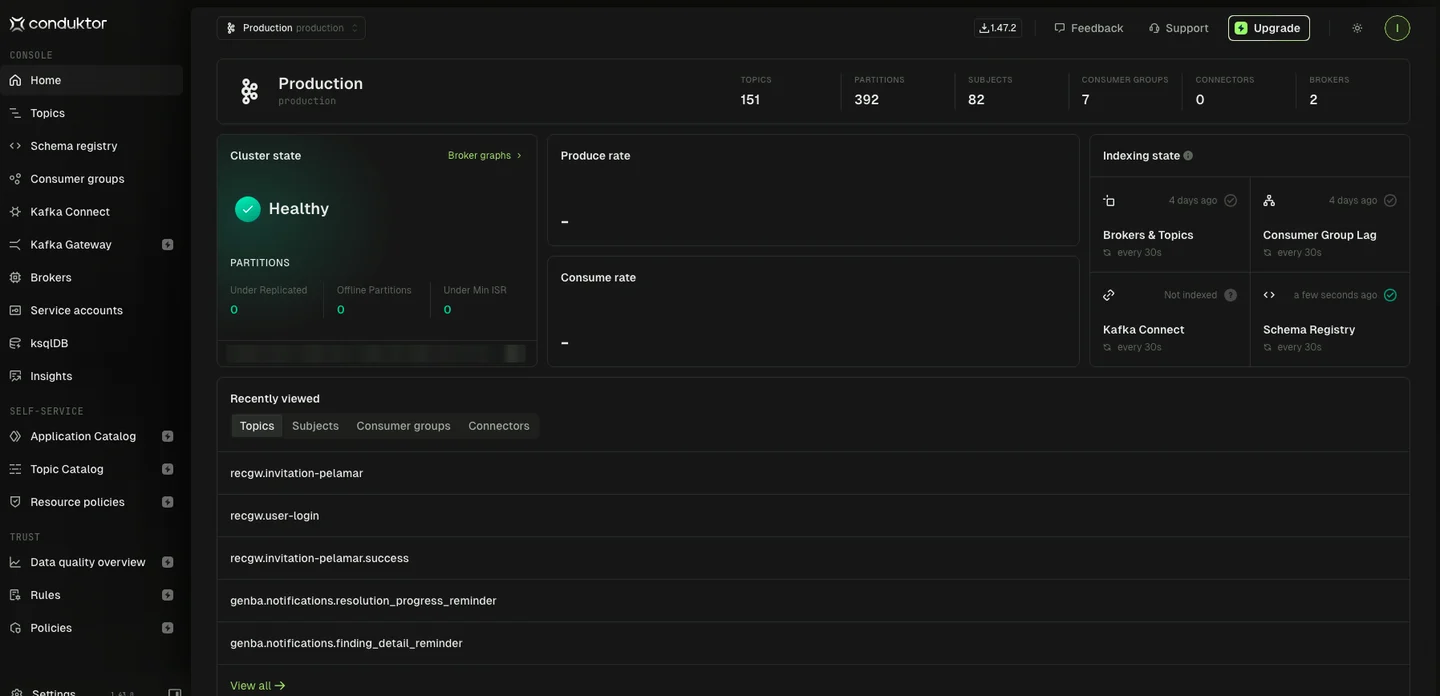
Figure 2: The production cluster in Conduktor, with 151 topics, 392 partitions and 82 schema subjects. Broker addresses are blurred.
4. Access and Storage
- Single sign-on: 10+ company systems sit behind one Entra ID login, so access starts and ends in one place.
- Object storage: ~2 TB and millions of employee documents moved from an unsecured file share to MinIO, with least-privilege policies per service.
Database access used to mean a shared login in a desktop client: unrestricted and unaudited. DBPortal replaces it with role-based access to 30+ databases, granted per connection and per table, and every query is audited. It works from desktop and mobile browsers, and it has an MCP server, so AI agents get the same per-table permissions as people do, and no more.
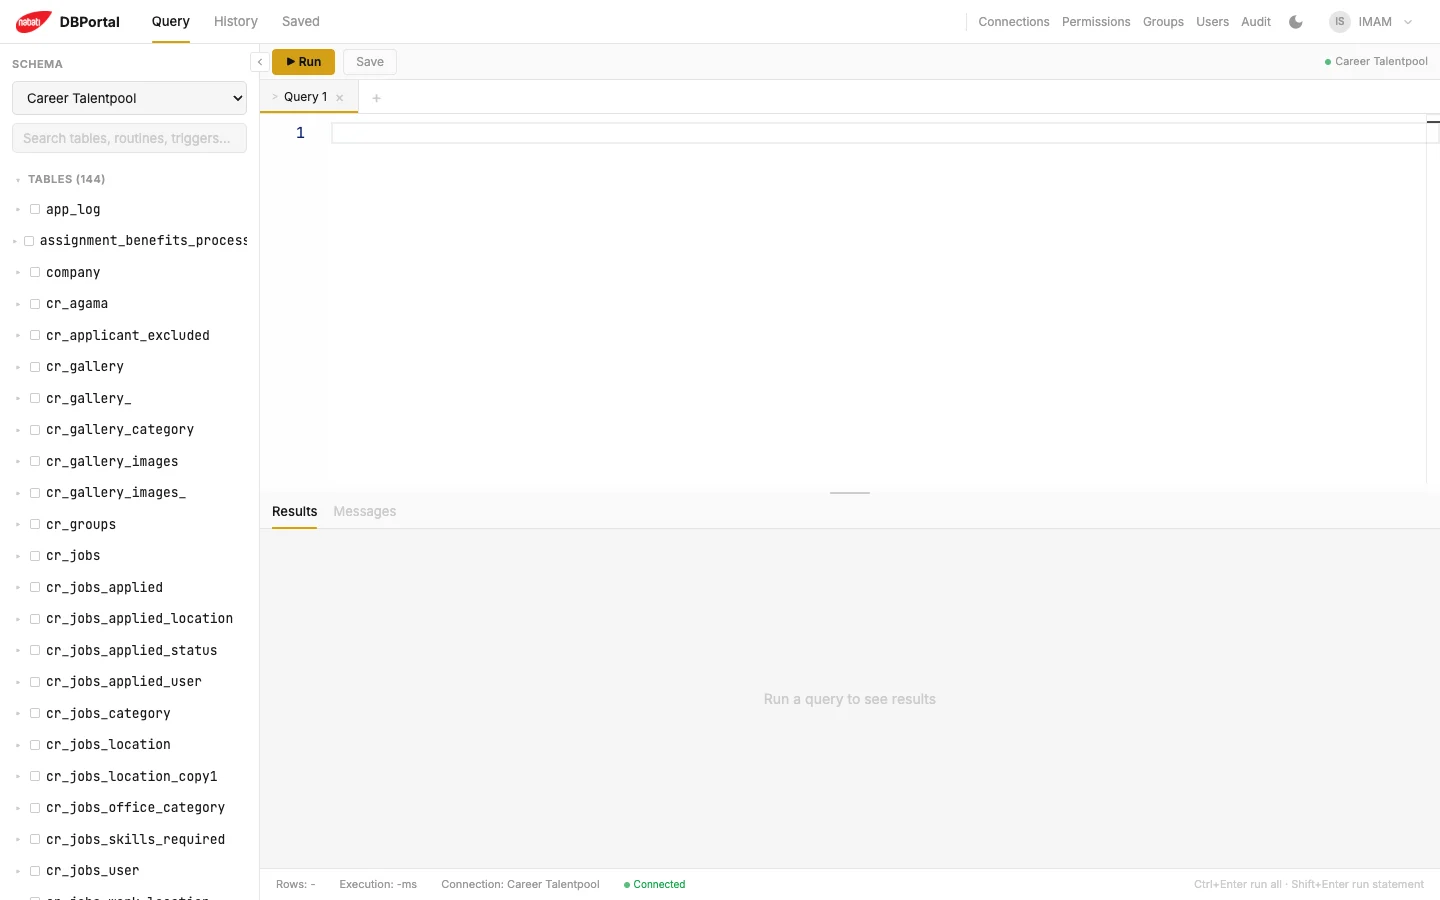
Figure 3: The DBPortal query editor. The schema tree shows only the tables this user has been granted.
5. Delivery
The author set up the delivery platform single-handedly: the self-hosted GitLab server and its repositories, the CI/CD pipelines, the Docker builds and the private container image registry. Every service now ships through it.
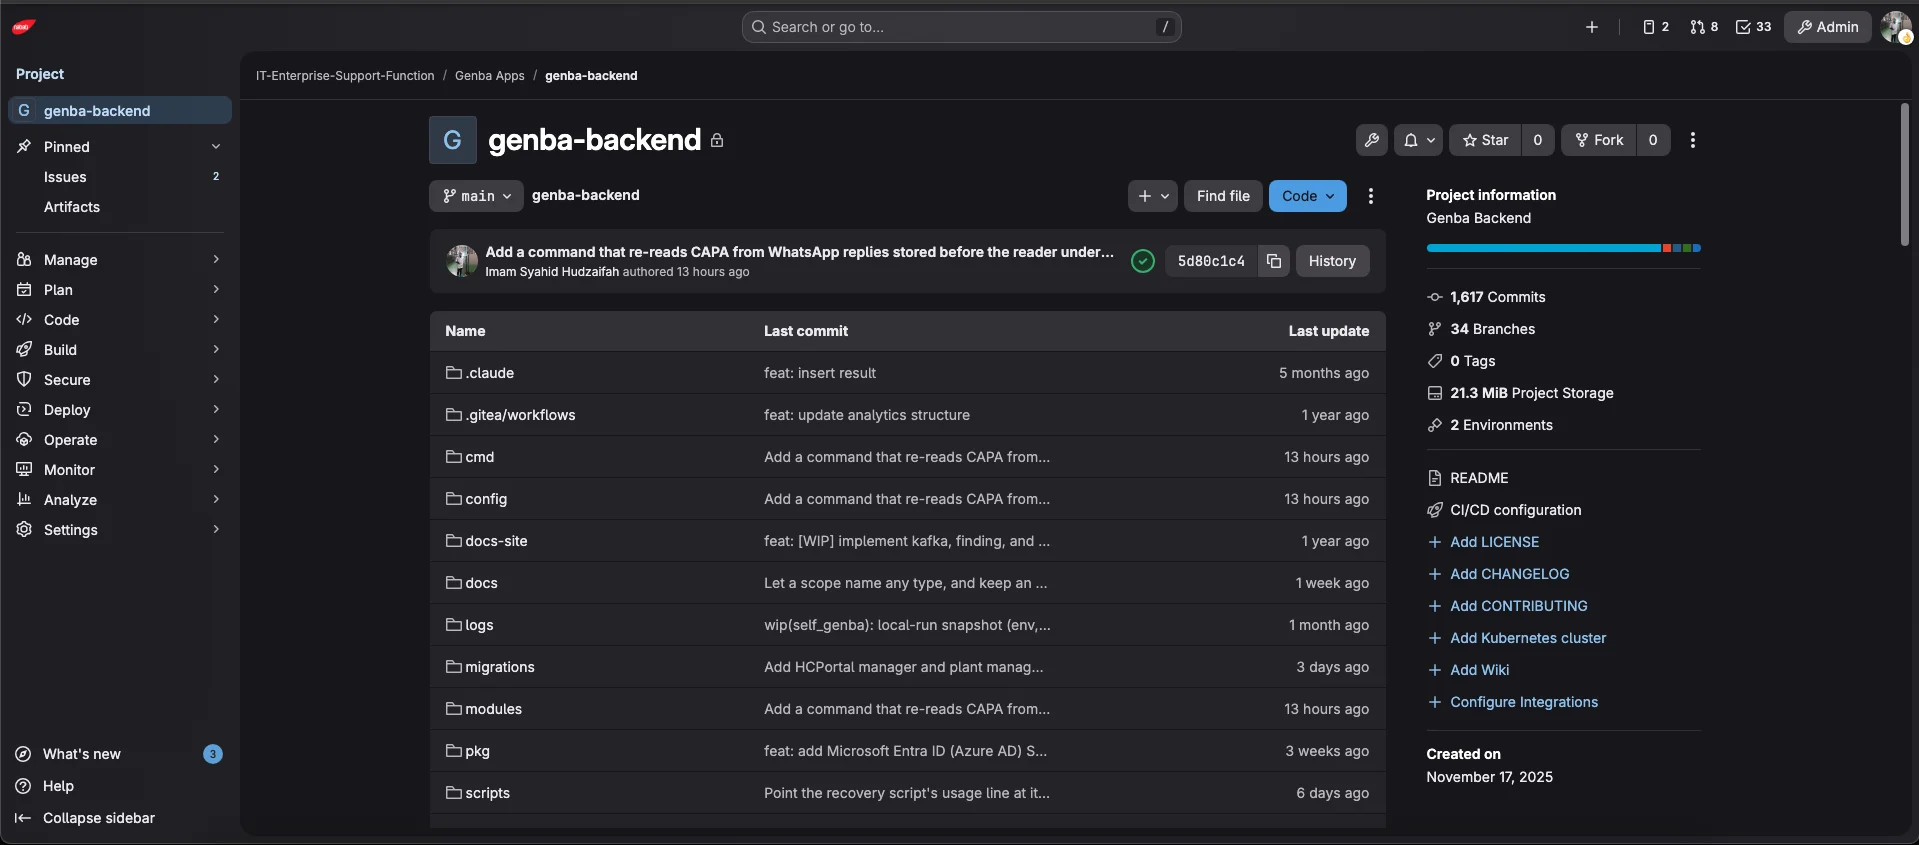
Figure 4: genba-backend on the self-hosted GitLab, with 1,617 commits, 34 branches and a passing pipeline on the latest commit.
- CI/CD: GitLab pipelines cut a deployment from ~1 hour of manual work to under 10 minutes, with SAST and DAST security scans on every release.
- Code quality: SonarQube scans 26 projects on every pipeline run, so issues show up per project instead of in production.
- Containers: services are built as Docker images and stored in the in-house registry; 5 of them are now stateless and scale horizontally.
- Dev environments: one-click VS Code Dev Containers took developer onboarding from days to minutes.
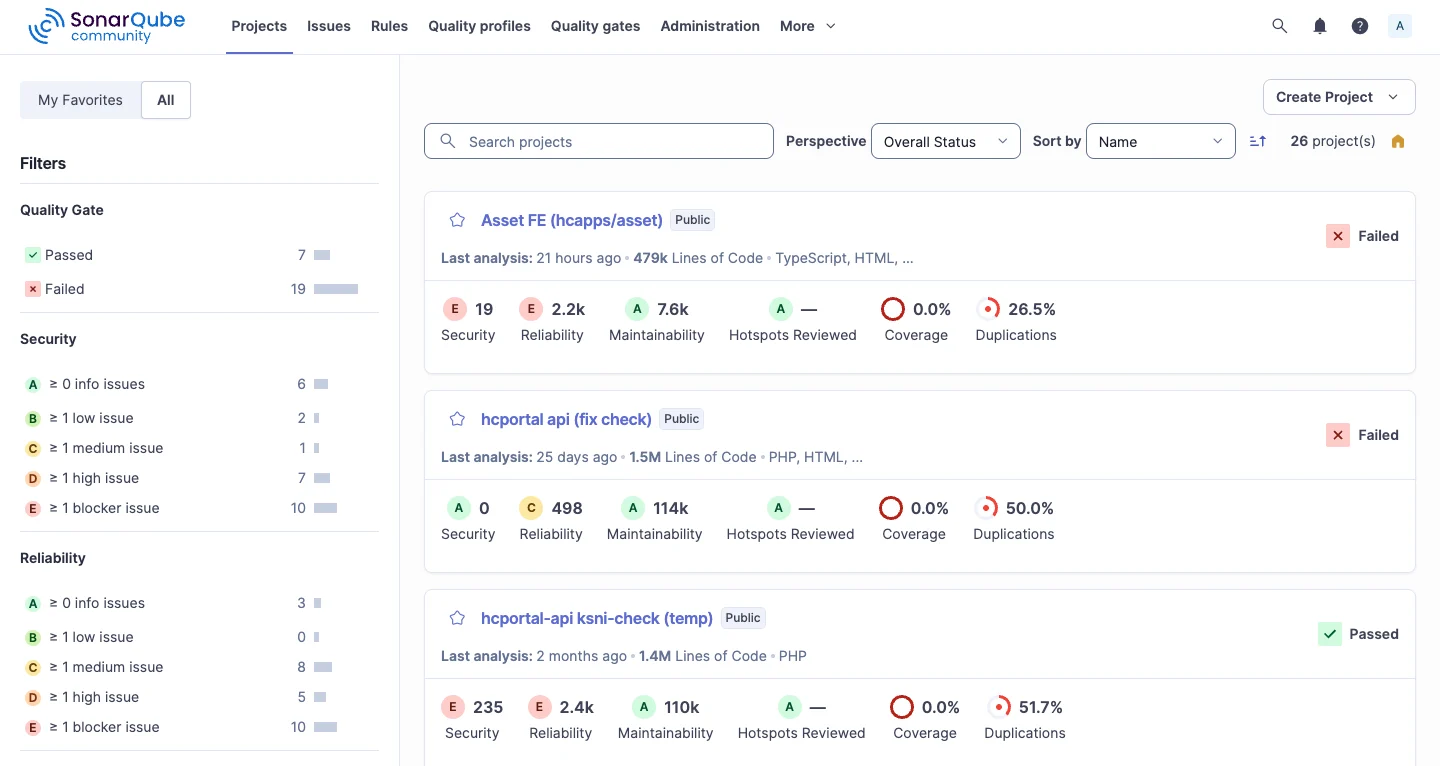
Figure 5: SonarQube, showing the quality gate, security and reliability ratings for each of the 26 scanned projects.